Simple Ways to Leverage Cost-of-Production Data to Drive Farm Profits
September 4, 2019

Farming, more than many other industries or career paths, can engender strong emotional ties — to the land, to a family legacy, to a strong work ethic, and to an experience of community.
This sense of mission or purpose is what draws many people into the agriculture industry. And for those born into it, farming often isn’t just a job — it’s a lifestyle.
Such a strong emotional foundation plays a critical role in supporting farmers during the lean years, but some farm management experts say a break from tradition can be necessary.
 “Too many growers today are simply going out and putting all of their inputs in the field because that is what their father did, and their grandfather did, and that’s what the industry says you should do,” said Jordan Wallace of GPS Ontario. “But it’s not always the correct, environmentally and sustainable way to do it.”
Wallace is a huge proponent of accurate Cost of Production (COP) calculations — understanding the dollar value of all your inputs needed to grow a specific crop — and he helps clients do the preliminary work required so they know this number, and use it to guide decision-making efforts on the farm.
“When you know your cost of production, you can make numbered decisions on the farm, not emotional decisions,” said Wallace. “You could be in the coffee shop talking about 150-bushel wheat or 70-bushel soybeans, but that doesn’t tell me anything. If you’re not making any money, what does it matter?”
Understanding cost of production should matter to all farmers. That’s why we put together this list of three quick steps to collecting and leveraging COP data that drives productivity, and profitability.
 Step #1 Make Sure You Have Good Data
According to Wallace, about 30 to 40 percent of growers track yield data. Most have a yield monitor of some kind within their operation but don’t have a GPS or a data card interfaced to it. Without this, farmers can only calculate an overall farm COP, but they won’t be able to track it by field or by productivity zone within a field.
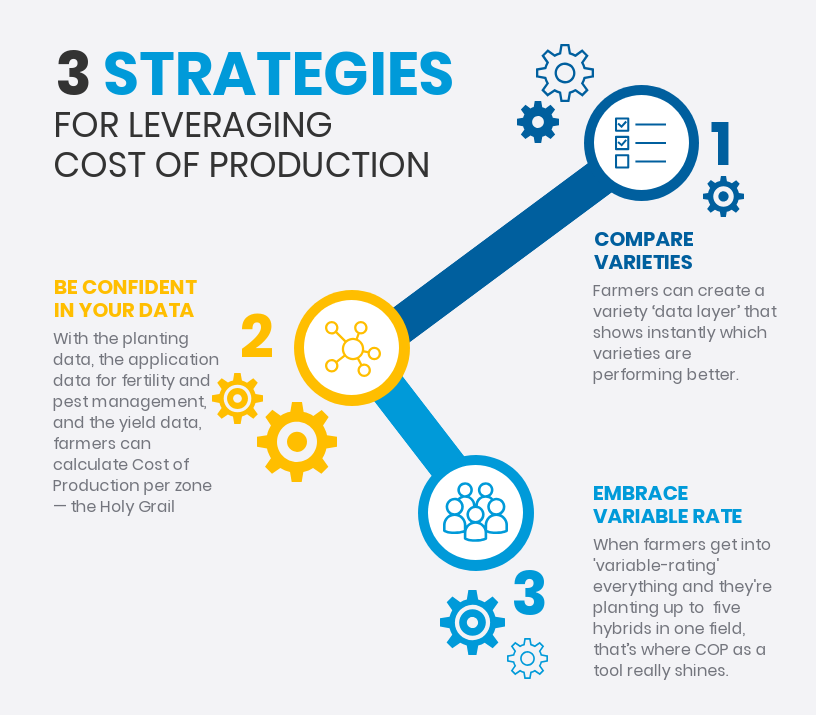
“With the planting data, the application data for fertility and pest management, and the yield data, I can calculate cost of production per zone, which is really the Holy Grail,” he said.
To achieve this, growers have to record all field applications, consistently. But it’s worth the effort.
Case in point: Wallace was working with a grower with some drainage issues. The farmer could clearly see that one area of a field was drowned out after a ditch was re-dug a few years back. The soil was spread within the first 60 to 80 feet in the field and as a result, the natural waterway and topographical slope was impeded and the surface water was unable to reach the ditch.
“What they did was create a drowned-out pocket in the field,” explained Wallace. “With yield data we were able to quantify the amount of yield loss right to the dollar amount for that area. We could see that not just half an acre was impacted — when we expanded the field zone out we could calculate the average for the field and found that 15 acres were impacted by that high water saturation level! Just because they had half an acre under water, that wasn’t the entire impact. If we could fix that drainage zone we would not just increase the field’s average yield, but bring that back into profitable production.”
The payoffs didn’t end there. By showing this grower what his COP was, Wallace could explain that the poor zones might be making only $5 an acre, or maybe losing $4 an acre, but in the end it took 40 acres of profitable production to bring up those poor zones so the field would break even.
“The problem is that most guys don’t have time to sit in the office and calculate this, and then see the value of producing it,” said Wallace. “They have to see that they’re losing, for example, $4 an acre and understand where are the highs and lows of that field that are picking it up.”
Step #2: Understanding Yield by Variety
With his clients, Wallace will typically create a variety ‘data layer’ that shows instantly which varieties are performing better.
“Here in Ontario, seed corn is purchased while guys are harvesting so with this, you can make better decisions on the hybrid selection,” he explained. “The problem is, they may not be making the correct decision if they don’t know the Cost of Production for that variety.”
Wallace said it’s taken a long time to convince some growers of the value of COP, but it’s an easier sell as ag software becomes easier to use.
“If you add all of your inputs, seed, and fertilizer blends in ahead of time and push it out to Trimble displays, you can get it to automate,” says Wallace. “It pulls the cost for Tractor 1, say $65 an hour, and starts associating the input costs automatically.” The cost of land taxes and land rent can also be added, he said.
Step #3: Cost of Production as a Step Towards VR
While some of his clients have been using variable rate, many others are still fixed. “VR adds another dynamic to that cost of production analysis that many growers are just getting ready for,” he said. “It’s easier to calculate per-acre or per-zone if it’s fixed because everything is equal, only your yield varies. But when we get into variable-rating everything and you have five hybrids in one field, that’s where we really shine.”
Along the way, growers have to remember to be patient. But by understanding COP and the significant contribution accurate yield data can make to profitable decision-making, they are well on their way.
For more information on leveraging cost of production data, please contact your local Trimble Reseller or Jordan Wallace at GPS Ontario.
