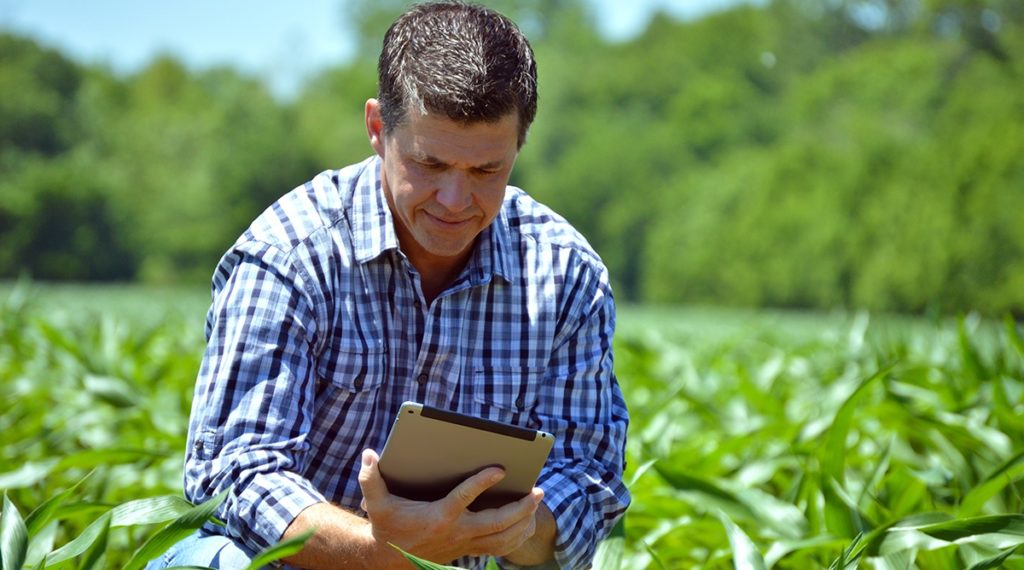
An ag retailer in southern Saskatchewan has established the Ultimate Yield Management Institute as a way of test-driving the performance of agricultural inputs so farmers can see the results.
“The reason we started is that there’s a lot of frustration from customers who have nutrition questions and there’s just not a lot of good nutrition and fertility research available in Western Canada,” says Dennis Bulani, owner of Rack Petroleum Ltd., a fertilizer and chemical retail business in Biggar, Saskatchewan. “This is our fourth year of trials and as a result, our agronomists are more knowledgeable because they have good, solid, replicated research.”
Bulani conducts field-scale research to investigate which combination of factors will produce higher crop yields. He describes it as “a performance review on the farm management system.” For example, in its third year of research trials, a canola study included 24 different fertility management systems that were replicated three times.
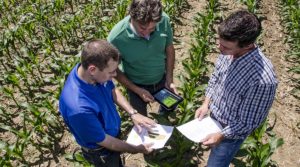
Bulani has teamed up with AGRI-TREND, a division of Trimble that provides agricultural coaching services to farmers, to share his research results with the coach network, who can in turn use it to provide recommendations to farmer customers.
Rob Saik, AGRI-TRENDís founder, says the formal partnership provides coaches with validated field research showing what farm input products and technologies can do to improve yields.
“Most of the agronomic information we rely on is very much out of date,” says Saik. “I looked at what Dennis was doing and thought, more people should be benefitting from this research. I wanted access for the AGRI-TREND coach network.”
The network has access to all research results from the past two years of field trials conducted by the UYMI. Saik says he was convinced after driving across canola trials and noticing the radical differences seen in the crop that received three different treatments.
“This is the kind of information our coaches need,” he says. “These compendiums have information in them that would benefit coaches and their customers. The products are available, we just need to know how to use them for the best results.”
Everyone is all hyped up over precision management, and there seems to be a sense that if you’re not variable rating some or all of your inputs, you’re somehow being left behind. But as Markus Braaten, AGRI-TREND Knowledge Team Lead and Senior Agri-Coach advocates, even the decision NOT to do precision management IS a precision decision.
Before we implement a precision management plan, we want to make sure that there is significant enough variability driving differences in productivity and affecting profitability — because our goal with precision management is to grow profitable bushels by managing that profitability. So, when should we incorporate more precision into our management? Braaten advises to start in the fields where your margins suggest you should. How? Start with the Profit Maps of your fields.
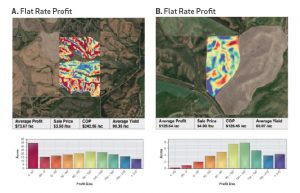
Before you implement any VR program, consult a profit map. At a single glance, you are able to see the areas not growing profitable bushels. This is where the cost of inputs and amendments is not paying off. Figure 1 Profit Map A is a field pencilled in for soft white winter wheat. In this field, significant of variability is affecting profitability, almost 25% of this field is losing this grower money.
From this profit map, he now knows where to investigate to determine the causal issues and whether they are fixable ñ physically, logistically or financially. He can then decide on a plan to those poorly producing zones that will keep them profitable. For the higher producing zones, he can decide whether is target yield and management practices are adequate or if they should be increased. For the average producing zones, he can decide whether to keep management the same or increase.
Figure 1 Profit Map B is a field also pencilled in for soft white winter wheat. In this field, there is definitely still work to do to understand the reason(s) for the low production but it might not be a field you start with if you have fields that look more like A.
The more the variability results in greater differences in cost per unit production between the low and high producing zones, the greater the opportunity there is to influence profitability through implementation of a precision plan. But don’t let lack of access to profit maps stop you. Utilize the imagery you have available PowerZone maps or satellite or yield maps. Pencil in ballpark yields by zone, do some quick math using input costs and sale prices and you have a rough guide. As more accurate numbers come in, you can refine this napkin math profit map.
Starting a precision management program with profit maps puts us in a much better place to measure ROI than does starting with a soil test, which is where we historically started. With a precision plan designed from a soil test, we are unable to answer the question of whether or not it worked. We cannot know if implementing the plan increased our profitability. Starting with profit maps lets profitability and the nature of the margin opportunity drive management decisions. Will these acres still be profitable after an in-season nitrogen application? What is the effect on profitability of a flat- rate fungicide application, what are the risks?
Starting with profit maps lets profitability drive the determination of management zones. Recognize that these zones will change year by year given the fluctuations of input costs and anticipated commodity value. Start using profit maps as a planning tool, rather than the postmortem of the year past. If you want to see an economic return from implementing precision management on your fields — precision being defined as the right rate and source in the right placement at the right time — it will require measuring results, adjusting the plan and measuring again.
Start with a profit map. Start in fields that have areas that are decreasing your profitability. Get better and better at tracking your costs, i.e. actual yields and sale price. Utilize the harvest data you have stored somewhere to refine profit maps. Review profit maps often throughout the growing season. Use the software and technology available to you through your Trimble Ag Software Farmer Pro account to simplify that effort. Ask your Agri-Coach for help with uploading harvest data, building profit maps and deciding where best to start and how best to reallocate scarce resources.
Think you are at the mercy of Mother Nature? Perhaps not with Trimble’s latest software feature. We are thrilled to announce the release of Hail Alerts. This new tool sends precise information about hail-damaged field areas right to a farmer’s inbox.
Hail storms can have a significant impact on crop yield, productivity, and resources. This time of year is stressful for farmers who closely watch radar reports and check – and double-check – their fields for damage. Large farms especially know just how much this uncertainty can drain valuable time and resources during a pivotal season.
“Hail alerts point you in the right direction and save you a lot of miles, especially with the remote areas of a farm and fields being so spread out. You might not have easy access to the far end of a particular field, but if you knew that’s where hail hit, you’d go out and check rather than getting a surprise at harvest time.”– David Renkas, Agri-Coach in Saskatchewan
Hail Alerts take the guesswork out of these hail events. It automatically notifies farmers of precisely when and where their farmland was hit and the size of the hail. Rather than driving around for hours, diverting valuable resources, farmers now know exactly where to go — or know where to direct their crop scout, field agronomist or hail adjuster to go — to assess and investigate possible remedy treatments ASAP.
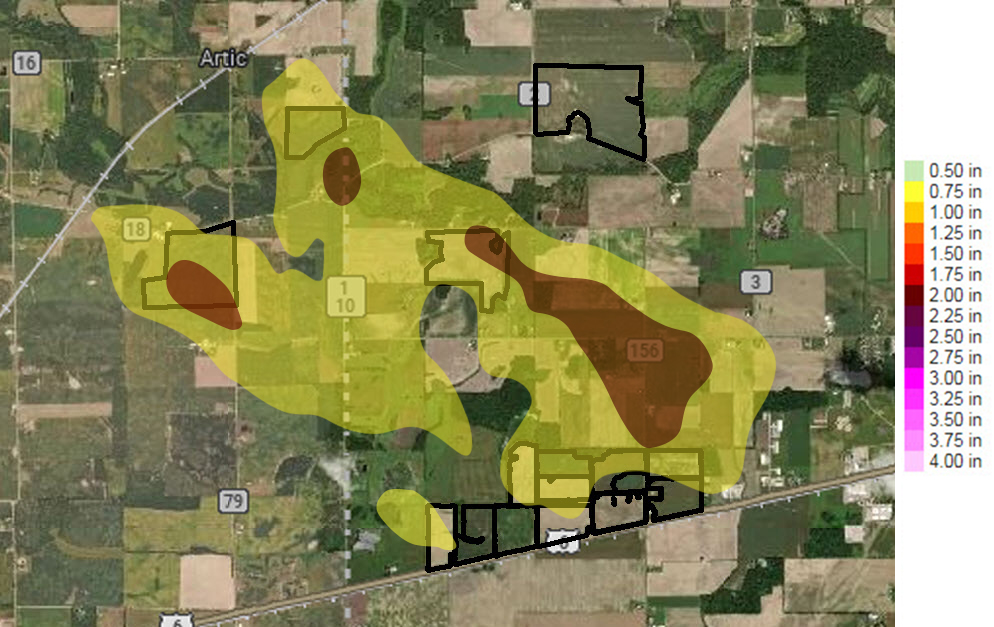
An automated email shows the precise size and location of a hail event, overlaid on the farm’s existing field boundaries.
Trimble strives to make farm management software easier and more powerful for our users. This latest software expansion serves as a powerful new tool for Ag Premium Weather users. The Ag Premium Weather upgrade is available for all Farmer Pro and Farmer Pro Plus customers in North America.
Don’t waste time guessing with Mother Nature. Read more about how Hail Alerts can help today.
Agri-Trend Aggregation, a division of Trimble Ag Business Solutions, is capturing headlines for being a key driver in the the first beef carbon offset project in the world.
Bill Dorgan, Agri-Trend Aggregation Business Unit Leader, worked with Feedlot Health Management Services in Alberta to establish the groundbreaking project that saw participating feedlots engage in verified practices that earned carbon offsets worth approximately $1million to the emitters involved in the exchange. Many more feedlots are expected to participate going forward.
“It’s an opportunity for everybody involved with agricultural sustainability to put out to the world what we’re doing in terms of greenhouse gas reduction and climate change,” Dorgan said in a recent media interview with a Canadian agriculture newspaper.
The project resulted in mitigation of emissions in feedlot beef cattle, and is a clear example of what the agricultural sector can accomplish in terms of greenhouse gas emission reduction and the use of offsets, said Dorgan.
While this is the first carbon offset program involving a feedlot, Dorgan has been helping Alberta farmers pocket cash by trading carbon offsets for years.
Carbon credits are produced by farmers under several protocols including Zero Tillage farming practices and the soon-to-be approved Nitrogen Emission Management program. Essentially, these efforts help farmers do their part to reduce greenhouse gas emissions by observing certain standards that reduce CO2 emissions. In exchange, they can sell those carbon credits back to heavy industry to ‘offset’ their emissions. These best practices help the environment, focus on good agronomy and provide a significant financial benefit to farmers.
The agricultural sector generates approximately 10 percent of the greenhouse gas emissions across Canada. However, since 2007, over 11 million tonnes of CO2 have been removed from the atmosphere in Alberta by improving agricultural management. Through farm data software such as Trimble Ag Business Software, growers can track the success of environmentally sustaining practices such as NERP — the Nitrous Oxide Emission Protocol — which was designed to meet international standards for improving nitrogen management in cropping systems and quantifying the nitrous oxide reduction associated with better nitrogen management.
Dorgan’s work helping farmers trade emission offsets has generated an estimated $35 million to Alberta farmers’ pockets.
Learn more about Trimble Carbon Credits and how you can start generating carbon offsets on your farm today.
For years, the inherent risk of running land-forming operations with GPS has been that drift is a possibility. However, the wasted time that happens with drift is far less likely than the more common delays that happen with laser technology due to factors like wind and dust. Still, downtime is still a big concern when using GPS-based systems, which have long been unable to overcome the increasing magnitude and repeated occurrence of drift.
This reality was made apparent in April 2017 when land forming operations across the delta region were in full swing until GPS systems across the area started experiencing drift with an impact never before seen. This level of drift caused entire operations to shut down, costing a lot of time, money, and heartache. However, not everyone experienced this setback. And so it’s important to understand what happened, why it mattered, and how delays caused by drift can be avoided.
1 – Why does drift happen?
The GPS signal comes from shared satellites in orbit that broadcast a timestamped signal. Your equipment then uses the difference between the time of reception and the time transmitted from the satellites to calculate your precise location. Your altitude, satellite delays, as well as the number of satellites you have access to can affect your vertical accuracy. When outside forces disrupt the signal from the satellites, the accuracy of the measurements your equipment receives can vary, well beyond their normal operating range. This is a big deal when you’re talking about finishing work in land forming operations, especially since it’s a game of hundredths of a foot rather than tenths of a foot.
2 – Why does it matter?
A significant error caused by drift can exceed as much as four and a half inches in vertical accuracy, like what the delta area experienced recently, and that halts operations in their tracks. Traditional GPS land leveling solutions can’t compensate and operate successfully with that large of an error and the risk of creating sizable holes and high spots becomes too great for crews to continue in those conditions and they are forced to stop.
3 – How do you avoid downtime?
Using the example of what happened in the delta area, crews that were using laser solutions were able to operate as normal since they don’t rely on the signal from GPS satellites and wind and dust weren’t a major issue at the time. Additionally, crews using VerticalPoint RTK were not impacted by the drift since the technology is designed to scale, understand and deal with a wide range of errors unlike any other solution in the industry and to keep the crew up and running, even in the most challenging environments.
“Apparently, VerticalPoint saved [us] yesterday. All I’m hearing is horror stories…and I never saw anything.”- Will B., VerticalPoint RTK User. (Reported the day after major drift occurred in the delta region).
If the solution you’re using can’t deal with drift, the only thing you can do to is make the most out of your downtime when it does happen. This usually means halting finishing work and completing as much bulk work as you can until the signal is more reliable.
An informal review of over 150 Agri-Trend’s farm clients covering 500,000 acres of VR over the past 7 years revealed an average net return of $35 per acre. Of that $35 – $7 were savings from reduced or eliminated inputs to low producing areas and $28 were earnings from improved yields in higher producing areas in the field.
It’s the combination of these two streams — the savings and the earnings — that make VR truly pay off. If you decide to adopt a precision management strategy, proper execution is key. Each step in the process brings you closer to maximum results and solid return on investment (ROI).
So you think you might want to get started?
First, keep in mind…Variable Rate is NOT Precision Ag… This subtle distinction requires that I define Precision Ag. I have two definitions; my most simple is the right management in the right place, and my most complex…Precision Ag is the management of variable yield potential. The management can be very coarse, eg. changing your cropping intentions and planting a salt tolerant grass in a saline area or grassing over a waterway rather than trying to seed through or around it, or it could be spreading of lime or sulfur using a spinner spreader across the area in need. Or the management can be fine eg. using variable rating seed and/or fertilizer rates by management zone.
Secondly, I cringe every time I hear VRT will save you money…it may…but using that as a hook is misguided. I’m actually asking my grower to spend more money…no, scratch that…I’m asking him to make a strategic investment. Zone creation, ground truthing, intensified sampling, additional services, VRT application, etc all require an investment beyond what my grower is currently doing. Properly deployed Precision Ag (note I used Precision Ag and not VRT) should increase a farmer’s profitability; it doesn’t, we should be fired.
In my opinion, Precision Ag should be positioned as a strategic investment that allows strategic resource reallocation to drive additional revenue to the bottom line by reducing average cost per unit of production. This requires we know and understand our yield potential; even if it’s just relative, FIRST. And then we implement the appropriate management strategy, which might be VRT fertility or seed.
In an effort to ease growers into the Precision Ag arena, we have come up with 5 steps that we believe will reduce confusion and facilitate a smooth transition.
Step 1: Determine the level and causes of variability across your fields.
There are numerous tools to help you do this; we like yield maps, PowerZone 2.0™ maps, elevation maps and soil conductivity maps. PowerZone 2.0 management zones start with up to15 years of satellite imagery that is processed with the PurePixel Vegetation Index to estimate crop productivity by year. These annual inputs are then combined and management zones are created. The result is an accurate summary of past crop productivity patterns that can be used to make management decisions for a field going forward. These powerful maps are an investment whose value as a decision-making tool will last for many years.
Step 2: Reduce over-application in underperforming areas
Once you have your fields ranked based on variability, look for fields with an opportunity to save money by reducing inputs in the low productivity areas. Typically about 10-20% of a field under-performs. In the review, savings from the reduction in inputs across these high-risk zones generally accounted for $7 of the $35/acre average net return attributed to variable rate fertilizer. In some cases, the causes for the underperformance can be addressed over time, ie water management but for now, reduce your investment in these areas.
Step 3: Investigate and correct the yield-limiting factors in the higher producing zones within your fields.
In North America, we know there are about five challenges per field on average. These could include pH, soluble salts, sodium, texture, compaction, soil profile depth, water table, weed patches, nutrient deficiencies, nutrient imbalances. Tools useful here are soils maps, plant counts, soil and tissue sampling and scouting.
Step 4: Adjust your yield goals and adjust VR rates
Now you are ready to take advantage of your fields’ new yield potential. Set yield targets in the high productivity zones more aggressively than you’ve set whole field yield targets in the past. Next, adjust your fertilizer rates to meet nutritional needs of crop at this new yield target. In the review, this step typically resulted in $28 of the $35/ac average return on investment for variable rate.
Use your yield maps and perform a yield-by-zone analysis to determine how close you came to hitting these new more aggressive yield targets. With a couple years of data, you will begin to determine your upper limit of yield potential by crop type with this data. Sometimes it’s helpful to think of yield targets in zones as a percentage above or below the field average. This may make it easier to set these targets on a farm level basis.
Step 5: Measure results and returns
Bill Gates has this to say on the importance of measuring results, “Measurement empowers decision-makers to determine best practice. Above all, measurement allows implementers to demonstrate effectiveness by making a clear link between money and results”. Again, there are a number of tools to help you do this but we like Profit Maps to show areas of financial loss and gain. Profit Maps are available through your Trimble Ag Solution subscription. Once yield data is in you can also compare VR against a constant fertilizer rate.
At a single glance, you are able to see where your fields are making you money, and where the cost of inputs and amendments is not paying off. Keep in mind, Precision Ag is a farm management strategy, not a one-year experiment. It is a farm management style that is best evaluated using profit maps over the long-term.
Back to the informal review of VR results coming up with an ROI $35/ac – this number should increase over time as your yield environment changes and your ability to match input with output goals improves.
There is no shortage of experts recommending new strategies on how farmers can negotiate a good deal on land rental.
I’d like to offer a more specific approach, tailored to growers who may be dealing with retired landlords or out-of-state heirs who are managing the land.
In most cases of land rental negotiation, flex rents are suggested as a good way of approaching this negotiation. However the complexity of yield and price formulas typical of today’s larger grower is unappealing to landlords used to a simple cash rent.
New Approach to Rent Negotiations
My Trimble Ag Software accounting customers and I produce crop enterprise statements by crop and field for each landlord. These show actual inputs as well as all other variable and fixed/overhead costs at the field and acre level and finally the total cost of production by acre and per bushel. These help landlords understand the significance of overhead costs — and that they are real costs. They can also see that two US corn fields with $740/acre costs have $4/bushel cost of production when the yield is 185 bushel per acre, and $3.44/bushel when the yield is 215 bushels per acre.
Table 1 is an example cost summary for all corn fields for one producer in 2016. The itemized details of each input and each account code have been removed for simplicity’s sake, but every single account cost is listed on the complete report.
Keep in mind these basics:
• CER (crop equivalency ratings) or CPI (crop productivity index) will vary from 54-92 in our area with many soil types and differences in soil drainage. We use our crop enterprise reports to show that some fields simply are not capable of as good a yield as others and therefore cannot support the same rent.
We print and give landlords a copy of “What is a Fair Rental Agreement for 2017” by David Bau from the Minnesota Agricultural Extension Service. David has many comprehensive past year actual returns and costs for Minnesota counties from the Farm Business Management records compiled at the Finpack center at the University of Minnesota. He also has budgets for the upcoming years and matrix tables for yield and crop price showing the amount left for rent after all other costs and a family living allowance are subtotaled. This publication is often an eye opener for landowners who do not realize that it is harder to pay $200/acre now than it was to pay $350/acre following 2012 prices.
We propose a base rent based upon the spring crop insurance price for corn with a flex adjustment if the fall crop insurance price is higher. This eliminates all price concerns about what day, what elevator bid, futures versus local basis, and other uncertainties.
Case Study
Let’s look at an example: the 2016 crop insurance price was $3.86, so we offered a rent based upon 50-65 bushels per acre x the spring crop insurance price depending upon soil productivity and drainage. This results in a rent of $193 on lower productivity land and $251 on well drained high productivity land. Another approach is that cash rent often works out to about 1/3 of total yield but this is something many landlords resist because they do not want to assume weather risk and uncertainty.
The flex is based upon corn — regardless of our cropping program for simplicity. We tell landlords that yield is our problem and we can ‘control’ it with management and crop insurance whereas price is somewhat out of our control. If opportunities are not offered by the market, we can’t fix a breakeven or profitable price when rent is high.
In 2016 the spring price was $3.86 and the Fall price was $3.49, so the landlord was guaranteed the spring price. If the fall price had been $4.49, the rents would have been $225 instead of $193 on lower productivity and $292 instead of $251 on high productivity. In these instances, the landlord would receive a nice fall bonus rent adjustment.
Many landowners in our area receive 100% of the cash rent in the Spring. This ties up lots of working capital and a higher percentage of the farm revolving line of credit operating loan. We have pointed out to landlords that ag lenders are limiting operating loan maximums to a formula based upon crop insurance revenue guarantees. As crop prices have decreased this has meant the operating loan is too small. A lender may provide $500 per corn acre and $350 per soybean acre or a 50/50 average of $425 per acre. The producer who pays $250 cash rent only has $175 left per acre for inputs and operations. In these cases; the landlord has not reduced rent but has agreed to half in the spring and half in the fall, relieving stress on the operating loan and working capital. Our producers can price some production to make the Fall rent payment over and above their usual marketing plans.
These suggestions may not work the first year a landlord is approached but a continuing appeal to fairness usually brings results over time. There are landowners who simply will take the highest bid, regardless of the effect upon the farm operator. In those cases, I urge my customers to let it go. We do not have the liberty to subsidize unprofitable fields with our profitable fields. I have been working with farm clients for 27 years and have yet to see a single customer go out of business because he gave up overpriced rented land. When one door closed, another one usually opened.
I should add that my more successful rent reduction negotiators are the fair-minded producers who voluntarily gave their landlords $25-35 bonus payments each year for about three years during the ‘good’ years. In many cases, they raised their rent from $200 to about $300 per acre over the three years, and now they have more good will to help them make necessary reductions.
I have customers being offered land parcels this week where the previous operator who was known in the community for aggressively paying big rents cannot pay the rents in today’s crop price environment and the landlord is not very sympathetic to their situation.
Remember: keep the faith, keep your landlords informed with thorough detailed reports on each of their fields. Share crop insurance APH histories and field operation photos. Work out tiling programs using long-term rental agreements. Always invite landlords to ride in the combine. My customers find value in printing yield maps from their Trimble Ag Software accounting and mapping, and a crop enterprise statement for each field.
Paul Gorman is available to help producers get cost of production at the farm and individual field level. You can reach him at drpaulgorman@yahoo.com or at 507-420-0138.
We had a great comment/question come across our agchat from Agri-Coach Andrew Clements, co-owner of Premium Ag Solutions in the Lethbridge AB area, referring to the interpolated yield map shown in Fig 1. “I see these all the time in the crop and you can also see them in Google Earth. Now I am seeing it in the yield data. Originally, I thought, it was due to swathing crops for so many years but not sure, why this would be so yield debilitating. Now I am wondering, what is causing this?”
Denis Vermette, Agri-Coach and owner of Ag Success Strategies near Winnipeg MB suggested, “Many years of discer ridges is my best guess. I see them all the time too but they usually have higher fertility because the farmers used to go up and down the corners when they were done the field to cover up the misses, which would result in higher seed and fertilizer rates”.
New Precision Support Specialist Jason Steffen offered his take on the situation – Having looked at many yield maps, my first question would be, “Was this yield data cleaned prior to use as a yield map?”
The other Agri-Coaches are correct in that these patterns can occur from past tillage practices. I’ve seen this pattern in fields where farmers used a moldboard plow to plow a field in a circle for many years. This caused the X pattern you see, as that is the point where the farmer would come back and clean up the turns.
However, that X pattern could also be an artifact of the how the yield monitor recorded the data. As the combine goes around the corner, the header may become fuller/emptier and the yield data recorded for those points won’t be directly related to the actual yield on the ground. If that was the case, those points should be cleaned from the data prior to bringing them in to use as a yield map. Without seeing the raw point data, this is difficult to determine what is really going on.
We all know that harvest is a period of great time pressure, with a just “get ‘er done” attitude. Nevertheless, time taken to ensure the GPS, yield monitor, and data storage device are working correctly and the combines are calibrated can make a tremendous difference to the quality and value of the data at the end of the season. Even after taking the time to set up the equipment properly, it is also important for the driver to follow certain procedures to reduce the amount of “bad” data generated. They must remember to set the monitor to the right Field and Load, set the correct Crop, drive at a consistent speed, keep the header full, and make sure the harvester is set properly and grain is not going out the back of the harvester.
The driver can do everything perfectly, yet harvesters will still encounter inherent errors that are specific to each machine, header, or crop. Because of the dynamic nature of grain passing through the harvester to the yield sensor, it is almost impossible for the system to accurately estimate the yield at any given point. Before using yield data, it is important to remove as many of the errors present in the data as possible.
The first error that needs to be resolved is the Flow Delay. When the GPS on the machine records its position, it provides the position of the machine as the crop is entering the head of the machine. However, it takes time for the grain to move from the head, into the harvester, through the separator, up the clean grain elevator, and then to the yield sensor where it finally measures yield. The consequence is that the yields are not mapped in the correct spot, and each pass going in the opposite direction create a saw-toothed pattern.
To correct this, we must enter a Flow Delay value that shifts the yield data back to the position it was “X” seconds back. This Flow Delay value is dependent on the harvester, head, GPS location, and even crop. Once the proper Flow Delay is entered in the display or the post processing software, the yield map will show yield transitions much more smoothly.
While the harvester is starting a pass, it takes time for the grain flow at the yield sensor to reach a steady state. Alternatively, at the end of a pass, it takes time for the grain flow to return to zero. We need to remove the points for the Start Pass Delay and the End Pass Delay. This is just a fixed number of seconds of data at each end of the pass that we just throw out.
Other points that we need to remove include those recorded when the harvester is traveling too fast, traveling too slow, or changing speed too quickly. Data that is harvested during these times is just not reliable. We need to remove unreasonably high and low values. “Reasonable” values can be determined using statistical analysis. Finally, we need to remove the data points recorded with partial swath widths or at angled headlands. Since the head is not harvesting a full swath in these situations, the yield sensor underestimates the yields. Fig 4 shows the yield map after these errors were removed from the raw data.
Another type of error can occur when two or more machines are operating in the same field and the data is combined. The distinct streaks indicate that one or both combines were not calibrated or there was big difference in how the two operators set and ran their machines. This map is not useful in its current state as the differences in the data from the two harvesters mask any spatial difference the yield data might show us. Before using this data, it is important to adjust the data so that all machines show yields in the same relative ranges. All of these errors contribute to create noise in the yield data and unless cleaned out, they reduce the value of the yield maps. This is especially true if you want to use the information for further decision-making processes.
Yield data is an incredible source of information about your fields. Ensuring that your harvesters are set-up correctly and they are collecting good data can be an important way to provide you useful information help you improve your future crop production plans. With good, clean yield data, we can:
• Get a report card on how your management practices did for the year
• Determine CPUP (Cost per Unit of Production) by Zone
• Create Profit Maps to determine where your management program is making/losing money
• Refine estimated yield goals to better match actual values in the field
• Calculate nutrient removals
• Determine better estimates of nutrient use efficiencies
The best practices to get accurate yield maps are as follows:
• Set up the yield monitor with proper farm, field, and crop information prior to starting harvest
• Perform factory recommended calibrations for each crop on each machine
• Confirm settings on display before starting each field
• Keep intake head full, adjust display if swath width changes
• Run the data through cleaning software after harvest. Your Agri-Coach can help you with this.
Jason Steffen has joined our Knowledge Team from Trimble as a Precision Support Specialist. He is based out of California. He is very knowledgeable about Yield Data and the value it can bring to an operation… providing it is cleaned and as accurate as possible.
Many of you are coming off a pretty tough year….either no rain when you needed it or too much rain. The first thing that likely comes to mind is “I am going to have to cut back on my expenses”.
One of the first places many look is soil sampling.
We would like to argue that this should be one of last places to cut back, in fact the soil sampling budget should be increased and that it will way more than pay for its self. Of course, you say, “that’s how you earn your living” but in fact we earn our living by ensuring our clients make money and see a return on their investment.
Without that, as my good colleague from Montana, Markus Braaten says, we should be fired!
So why is soil sampling even more important following a tough year?
1. You will have a credit in your soil bank account
You spent a lot of money on fertilizer last year and safe to say, it didn’t all go with the grain.
For many harvest is still in the field so clearly actual yields are nowhere near targeted; this means that some of fertilizer put down in 2016 will be available for the 2017 crop. While it is not as simple as 50% of normal yield, 50% of fertilizer left, below is a rough example.
If we fertilized to grow 70 bushels of wheat and only pulled off 50, using average crop nutrient requirements, we can calculate nutrients left over in the soil and in the straw residue. Based on N alone, there is enough left over to grow 33 bu of wheat without any additional N fertilizer. Over a 2000-acre farm, that is potentially $66,780 of found nitrogen. Now… what portion of these nutrients will be available for next year’s crop? That is what the soil analysis helps determine.
This is especially true for those fields that for years have been fertilized based on average soil test, so parts of the field are under-fertilized and others, the underperforming parts, are over-fertilized. Typically, 10-20% of the field under-performs when compared to the rest of the field. Why not take $ spent on areas not needing any more fertilizer and spend it on areas that do. To do this with any accuracy, yes soil samples are needed.
OK, so maybe a soil sample but why so deep?
Here is a comparison of a 0-6″ sample vs a full profile sample 0-24″. Here’s a real world example from a number of years ago. Agri-Coach Phil Parker AgSoilutions Inc. and his then partner Ron Curtis, out of Neepawa were working with a customer who had purchased 3 new fields. For years, this land only had a 0-6″ soil sample taken. The first thing they did was take soil samples to depth (0-6″, 6-12″ and 12-24″). Here are the results from those 3 fields – $15,845 worth of N credit at current $/lb N values.
Phil can cite another example where they finally convinced another client to take deeper samples and found that over 8000 ac, they were sitting on roughly $72,000 of nitrogen alone in the lower depths.
There are MANY more examples of “found” nutrients within the Network. Soil sampling reveals the redit available!
Another good reason to sample to depth is to better understand the other macro nutrients and micronutrient profiles. Nutrients can either increase with depth or decrease with depth – without the soil test how do you know?
For example, let’s look at copper and presume we are growing wheat:
• If surface is below 2.3 ppm but increasing with depth – plants quickly grow through the deficient zone to access the abundance of nutrients below. Unless the growing season is wet, then active roots are predominantly restricted to the soil surface with little access to Cu reserves below. You can plan for tissue tests and a foliar treatment of Cu at flag to boot stage, if necessary.
• If surface above 2.3 ppm but decreasing with depth –plants quickly grow through the abundant zone producing the majority of their root mass in the deficient depths, this is especially true if the growing season is dry. Knowing this you can now plan to get some copper in the soil and foliar treat after tissues.
Soil sampling eliminates the guesswork!
2. You have access to “free” nitrogen
Remember 1% OM contains 1000 lbs of organic N and 100 lbs of organic S. We use the % OM in the top 6 inches to calculate ENR. ENR or estimated nitrogen release approximates the amount of N released from the OM over the growing season. In western Canada, values will range from 4-12 lb/ac depending on many local factors.
By not taking into account ENR, you could be missing roughly $1-5.50/ac worth of nitrogen; again over 2000 acres, nothing to be sneezed at $2,000 to $11,000.
Soil sampling reveals the free stuff!
3. You could have a credit limiter or lien on your soil bank account
Other factor(s) might be preventing the full withdrawal from your soil bank account.
We usually find that the biggest hurtle to overcome is not a nutrient shortage but a soil chemical or physical issue such as pH, salts, sodium or magnesium levels that are limiting yields. Here no matter how good your fertility program is, without rectifying the limiting factor you are wasting fertilizer dollars.
Another thing we find is that there may be a good level of nutrition but the ratios are out of balance. Here again, adding more nitrogen to a soil that doesn’t have enough sulphur or potassium to enable the plants to use that nitrogen is a waste of fertilizer dollars.
The other situation we often see is that, in general, farmers are OK with spending money on nitrogen, sulphur and even micronutrients but for some reason the non-mobile nutrients like phosphorus and potassium are usually applied at far less than removal rates. This usually leaves them in a catch-up situation before more nitrogen is needed to optimize yield.
Soil sampling reveals the factors limiting nutrient utilization.
4. Water drives everything
By using a moisture probe or with a little practice, estimating moisture by feel while we soil sample, we can get an idea of current plant available water. Add to that any fall/winter precipitation that falls after soil sampling, we can more accurately determine a target yield goal and a fertility program to match. It establishes how much fertilizer is recommended up front and how much we hedge, and wait and see to apply.
Soil sampling reveals yield potential.
So to quote Roman playwrite Plautus, “You have to spend money to make money”, soil sampling is an investment that ensures you are spending your money in the right places. If the goal is to grow profitable bushels then soil sampling and analysis are fundamental.
Precision ag professionals such as Daniel Hedgecock, who runs a new Vantage dealership in North Carolina, is working hard to help growers scale their data so the system can quickly disseminate reports that will be increasingly required for compliance agencies.
This means proper naming of fields, proper record keeping and proper input tracking all the way down the line.
“A lot of vendors have data, but it may not be easy to quickly turn it into a report they need to provide to a regulator,” says Hedgecock, who works with a team of agronomists and farm data experts. “The software can do that, but it needs to be scalable.”
This is particularly important for larger growers, he says. “With large farms it can be hard for them to know what’s going on on every acre. At the same time, they are thinking, ‘I bought this tractor and I need to farm this many acres to justify that expense.”
Scaling is also vital for farmers expanding their operations in order to capture economies of scale.
“When farms are smaller they’ll have a system of naming conventions for fields, crops, zones, pivots — but it’s not a standard one that will let them scale their business,” says Hedgecock. “Think of a mom-and-pop hardware store. They can come up with part names, track them in a notepad and it works. But at Lowe’s Home Improvement everything has to be named and tracked in a particular way to move through the system. This is where larger growers are trying to get to and we have to put the data management tools in place to help them do that.”
A Good Software Solution Ties Whole System Together
Growers today are working harder than ever to squeeze value out of the technology they’ve invested in. This is made possible by the right farm data software tool…because as we know, the information coming off the equipment is only as good as the data system used to turn it into smart decisions.
This is where precision farming becomes decision farming; it is also where investments in farm data begin to truly pay off.
More and more, research is showing that successful farmers track every detail of their operations. With lower commodity prices putting pressure on profits, and the move to precision ag adding new complexities, mobile-friendly farm management software is becoming a requirement for farming today.
Most farm software tools require users to spend hours in front of a computer — something farmers simply don’t have time for. Trimble Ag Software is mobile-enabled for farmers’ busy lifestyle. Growers can set out crop plans by field (and by zone). From input purchase lists to budgets to fertility, this planning tools helps growers strategize for the best possible crop season. Some of these include:
Fertility planning
Crop planning
Budgeting
Precision prescriptions
Another advantage is the ability to create easy-to-print field task reports — a trademark of our software since 1992 — to stay organized.
Most field activities are automatically generated from precision farming data or our mobile app. Some of the key reports include:
Seed varieties
Tank mixes
Restricted-use pesticides
Fertilizer usage
Harvest data
Grain storage tracking
Farmers can import yield, soil type, soil test results and other key data layers to assist in creating simple variable rate prescription maps for seed, crop protection or fertilizer applications. Precision farming maps can also flow into a farmer’s field record keeping for a complete farm management software solution. Additional precision ag tools include:
NDVI
Variable rate prescriptions
Irrigation tracking
Imagery support
As a supplier of both ag software and hardware tools, Trimble products are a ‘natural fit’ and integration is streamlined and efficient. Guidance lines can be stored directly in the software for use with Trimble guidance products that provide the high level of accuracy our users demand. Variable rate prescriptions and as-applied maps move wirelessly between Trimble Ag Software and Trimble displays for increased efficiency and productivity.
 There is no shortage of experts recommending new strategies on how farmers can negotiate a good deal on land rental.
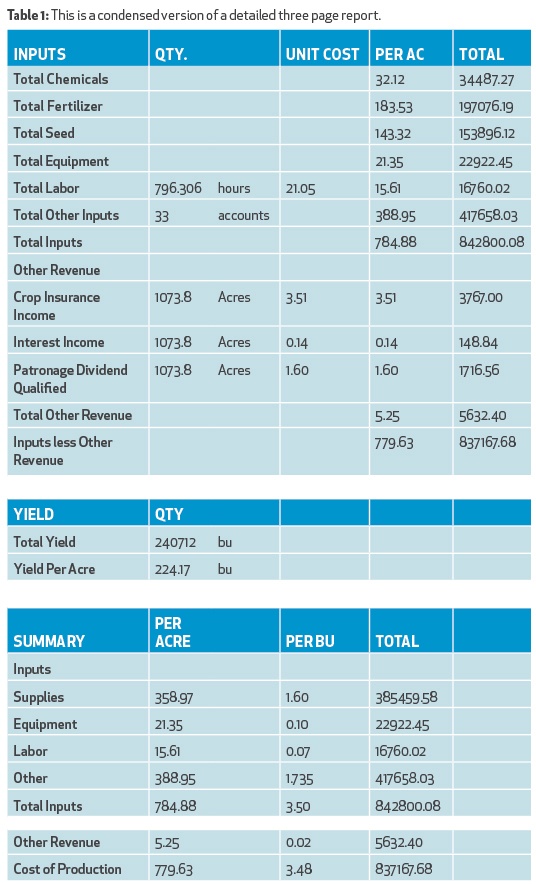
 Precision ag professionals such as Daniel Hedgecock, who runs a new Vantage dealership in North Carolina, is working hard to help growers scale their data so the system can quickly disseminate reports that will be increasingly required for compliance agencies.