| Information banner |
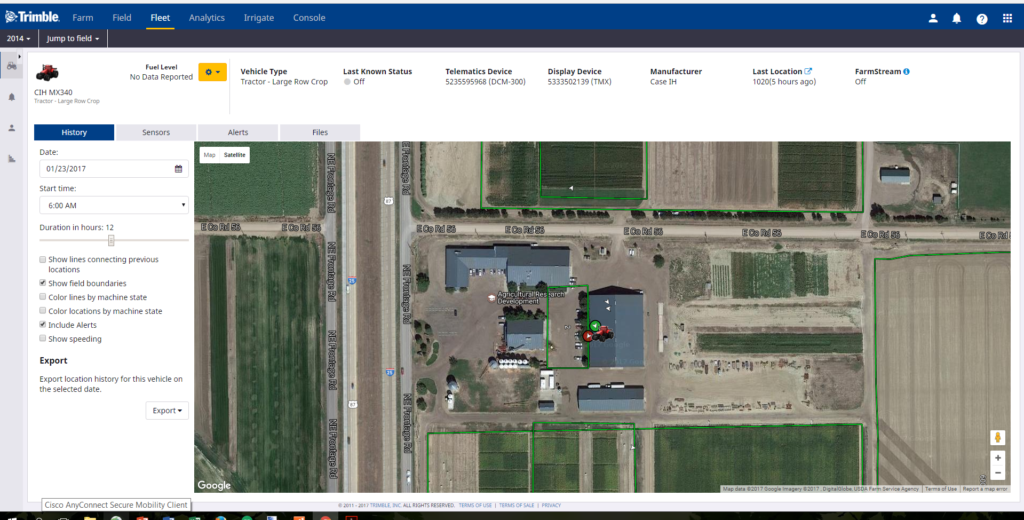
The information banner shows the following information:
- An icon representing the vehicle, with below it the name of vehicle and the group to which it belongs.
- An icon representing the fuel level, if fuel level data is available.
- Type of vehicle.
- Last Known Status of the vehicle. The options are moving, working, stopped, off, pending, rushing, no GPS, speeding, and delayed.
Note: The available status to report depends on the type of Fleet in use and the vehicle setup. For more details, refer to the Feature Chart comparison.
- Telematics Device serial number (traditional Fleet only).
- Display Device used on the vehicle (FarmStream only).
- Manufacturer of the vehicle.
- Last Location of the vehicle at the time the system was updated. If the vehicle was in a field and the user has selected to show location as field name, this will show the field name of the last known field the vehicle was in.
- FarmStream status – shows whether this vehicle is set up for FarmStream or the traditional Fleet setup with the DCM-300 modem as a telematics device (FarmStream on or off).
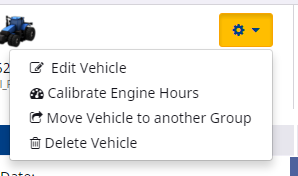
From the drop-down menu (shown next to the fuel icon), you can now do the following:

|
| History tab |
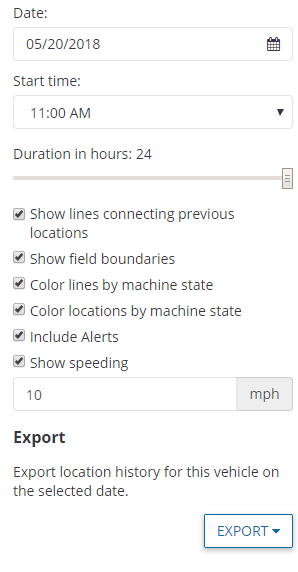
This tab allows you to:

- Select a Date using the date picker.
- Select a Start time from the drop-down list.
- Use the slider bar to set the Duration in hours.
- Select Show lines connecting previous locations to see location and travel routes.
- Select Show Field Boundaries to see field boundaries on the screen.
- Select Color lines by machine state to see the different vehicle states on the connecting lines – depending on the Fleet set up that you are using, the options are Moving, Working, Stopped, Pending, Speeding, Delayed, No GPS, Rushing, and Off.
- Select Color locations by machine state to see the different vehicle states—depending on the Fleet set up that you are using, the options are Moving, Working, Stopped, Off, Pending, Speeding, Delayed, No GPS and Rushing.
- Select Include Alerts if you want alerts to be shown.
- Select Show Speeding if you want speeding indicators to appear on the History page if a vehicle is speeding (based on a user-defined speeding threshold ).
- Set the speeding threshold by entering a value in the field (mph or km/h). Any speed values recorded at or over that threshold will be marked as speeding on the map.
- Click Export to view the vehicle location history in kml or shape file format.
|
| Sensors tab |
This tab shows sensor data.
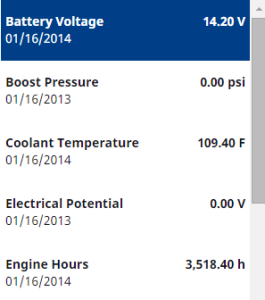
- The left-hand pane shows high-level information provided by the sensor, such as battery voltage, boost pressure, and temperature. Available sensors will depend on what the vehicle sends to the sensors software – it varies by machine model. The software could show any of the following parameters: Hydraulic Oil Temperature, Hydraulic Oil Pressure, DEF (Urea) level, Engine speed, Coolant Temperature, Engine Oil Pressure, Battery Voltage, Intake Manifold Temperature, Boost Pressure, Engine Load, Engine Oil Temperature, Coolant Level, Electrical Potential, Engine Hours, Fuel Rate, Fuel Level, Engine Oil Level, Hydraulic Oil Level and Hydraulic Oil Filter Restriction Switch:

- If you click on an entry in the left-hand pane, it charts the data in the right-hand pane. If required, you can change the date using the date picker at the top of the pane for the current date:

Sensor data requires a connection to the vehicle’s CAN bus. For a list of supported machines, refer to the most current Fleet Utilization Supported Platforms list. If you believe there is an error check the following:
-
- Vehicle might not be connected to a wireless network and reporting data or may not be part of an organization that has a Display Connections (formerly Vehicle Connections) license.
- Vehicle might not have Fleet service enabled.
- No connection to the Vehicle’s CAN bus, or incorrect CAN harness installation.
|
| Alert tab |
Shows a list of alerts for this vehicle only. |
| Files tab |
Shows all files that you downloaded or uploaded to or from your display.See Downloading and uploading files. |


